Tech Infused Retail Monday Morning Reads - September 9, 2019

Here is what I found interesting in today’s world of retail:

  • Over half of Americans prefer all at once TV show releases vs staggered. Link

  • Alibaba used AI for New York Fashion Week looks. Link

  • Millennials are taking over fashion too. Link

  • Alibaba acquires largest rival. Link

  • Amazon and Roku battle for your TV. Link

  • Streaming music makes up 80% of the music industry revenue. Link

  • The world’s most expensive retail playground is struggling. Link

  • Everyone loves the lending game, Stripe Capital is the latest to enter the game. Link

  • Influencers are seeing less engagement with the disappearance of likes. Link

  • Facebook dating now challenging the IAC dating monopoly. Link

  • 43% of survey respondents interested in Disney + streaming. Link

  • Amazon now testing the “New” badge. Link

  • Amazon pushes faster shipping at all costs. Link

Tech Infused Retail Monday Morning Reads - September 2, 2019

Here is what I found interesting in today’s world of retail:

  • Ulta struggling because of your boring beauty routine and influencers overdoing it. Link

  • Hotels have piled on brands, this could be a problem. Link

  • High school sports participation is down for first time in 30 years. Link

  • Peloton is a phenomenon, can it last? Link

  • Puma opens new flagship. Link

  • Here come more tariffs. Link

  • Target’s Drive Up service now available across the US. Link

  • Don’t discount Costco’s chances in China. Link

  • House cleaning at Hudson’s Bay continues. First it was Lord & Taylor, now it is European operations. Link

  • A look at the community still keeping the NCAA Football video game up to date. Link

Tech Infused Retail Midweek Reads: Snapchat, Peloton, Costco China

A few articles in the world of retail I found interesting this week:

  • Taylor Swift stopped selling out her concerts to make more money. Link

  • What drives our addiction to social media. Link

  • How companies like McDonalds are using podcasts. Link

  • Peloton files for IPO, fast revenue growth and high losses. Link

  • Snapchat disappears from Venice Beach. Link

  • Instagram is going after Snapchat again. Link

  • Costco is taking it slow in China, first store opening brought crowds. Link

  • Adidas signs first pro gamer deal with Ninja. Link

  • Ride sharing continues to crush airports. Link

Tech Infused Retail Monday Morning Reads

Here is what I found interesting in today’s world of retail:

  • Facebook has forced Instagram to double ads in the past year. Link

  • Amazon using 3rd party sellers grow its’ business. Link

  • Amazon makes it harder to gauge consumers health. Link

  • As Shopify grows, developers are forced to adapt. Link

  • Amazon testing “Top Brand” label for some apparel brands. Link

  • Boxed to offer apparel via Century 21 partnership. Link

  • Banana Republic joins the rest of the industry in providing a rental service. Link

  • Google Assistant continues to be top voice assistant. Link

  • 70% of consumers said they trust influencers as much or more than their real life friends. Link

Amazon Earnings Disappoint, Yet No Worries Here

Amazon disappointed many with their earnings but the headlines failed to report the good news with the bad. In the shadow of AWS growing <40% for the first time, the top line business returned to a 20% growth rate. Services remain strong as the business continues to shift with <49% of the business now being accounted for by the online store.

DoorDash > Grubhub

Further to the Food Delivery Wars post from last week, Quartz is reporting based on Second Measure data that DoorDash is the #1 US delivery company. Notice that Square’s Caviar has been relegated to the “Other” category and Uber Eats hasn’t grown market share in over a year. Might this turn up the heat in the Grubhub kitchens and force a DoorDash acquisition by either Grubhub or Uber?

FullSizeRender.jpg

Connected TV Ad Impressions Rival Desktop & Mobile Combined

Connected TVs now own the top spot for digital video ad impressions. The total share in Q4 2018 matched the combined share of desktop/laptop and mobile. Ad based offerings from Roku, Hulu and YouTube are growing rapidly with no end in sight. Companies like The Trade Desk are calling connected TV growth the fastest growing market they have seen and we will ever see in marketing. This market is predominatly programmatic and highly efficient and begging for every marketer to pay attention.

May Sales & Tariffs

Census Bureau released the May retail sales figures on Friday. The report was particularly strong considering all the chatter of tariffs potentially slowing retail sales as price increases trickle down to consumers. April was revised upward from the initial report which drove the GDP estimates higher for many analysts.

The overall number for May was +3.2% from 2018 with winners being nonstore (online) posting the routine >10% increase, food services/restaurants, health and auto retailers. Those in the negative year over year were sporting goods, clothing, electronics/appliances and department stores.

Interestingly, the April number for electronics/appliances figure was positive in April but negative in May. Bespoke highlighted how the share of imports of steel and aluminum has already shifting away from China to Mexico and Vietnam to avoid the tariffs (see below). It may be too early to see the true impact of higher prices passed onto the consumer but this and jobs report were suprisingly strong.


Confusing Ecommerce Delivery Options

The ongoing battle between the three major retailers has me completely confused and befuddled. Let’s just look at the options by retailer:

Amazon

  • Prime - Guaranteed 2 day shipping comes with an annual or monthly subscription for the large marjoity of what they offer on the site.

  • Prime Pantry - An extra $4.99 per month for unlimited deliveries over $10, free for Prime members with orders over $35.

  • Prime Fresh - Strictly for groceries.

  • Subscribe & Save - Subscription on items delivered each month (or every few months) where savings increases with the more you add.

  • Add-On - Can only be added to orders over $25.

  • Prime Now (Amazon) - $4.99 per delivery in a few hours unless over $35.

  • Prime Now (Whole Foods) - $4.99 per delivery for Whole Foods items (some products overlap with Amazon catalog) unless over $35.

Target

  • Restock - Next day delivery for $2.99 unless over $35.

  • Shipt (just announced) - Same day delivery for $9.99.

  • Subscription - Delivered each month.

  • 2-day Ship - Free over $35.

  • Pick-Up In Store - No fee.

  • Drive Up - No fee.

  • Google Express - Free over $15.

Walmart

  • 2-day Ship - Free over $35.

  • Pick-Up In Store - No fee.

  • Drive Up - No Fee.

  • Unlimited Grocery Delivery - New subscription service for $99 annual fee.

I likely missed several options but is anyone confused yet? Amazon is the most confusing and the Whole Foods acquisition surely hasn’t helped. Although the array of options likely hasn’t slowed the transition to ecommerce and led to more consumer options, the experience of selecting which and understanding your options is incredibly cumbersome.

Food Delivery Wars

Amazon surprised quite a few people yesterday by announcing they are shutting down their restaurant delivery service in the US later this month. Similar to the shutdown in London last November and subsequent investment in Deliveroo, many believe Amazon will invest in one of the other food delivery providers in their next round.

With recently public competition like Uber, heavily funded private companies like Postmates and DoorDash and niche players like Square’s Caviar, there is no shortage of competition. Just ask the largest incumbent Grubhub who owns Seamless:

Although it is projected by William Blair that restaurant deliveries will only account 11% of total restaurant by 2022, the space is growing RAPIDLY and all that growth is coming from the delivery providers:

@ryanmcraver 3rd party restaurant deliveries.png

So with Amazon out of the race, what happens next? I would assume either Postmates or DoorDash is acquired by Uber to bolster their Uber Eats offering. In my opinion, Grubhub just doesn’t have the confidence of their shareholder base, the cash or ability to add a secondary offering of stock to buy either. I believe Square truly isn’t interested in this business and has positioned Caviar as the higher end offering. Jack Dorsey wakes up each morning to be a payments and social media guy, not the delivery king. Regardless, this is a scale game and you have some hungry competitors who are likely looking to consolidate the market into more of a duopoly to gain further leverage:


A Quarter to Forget For Many Retailers

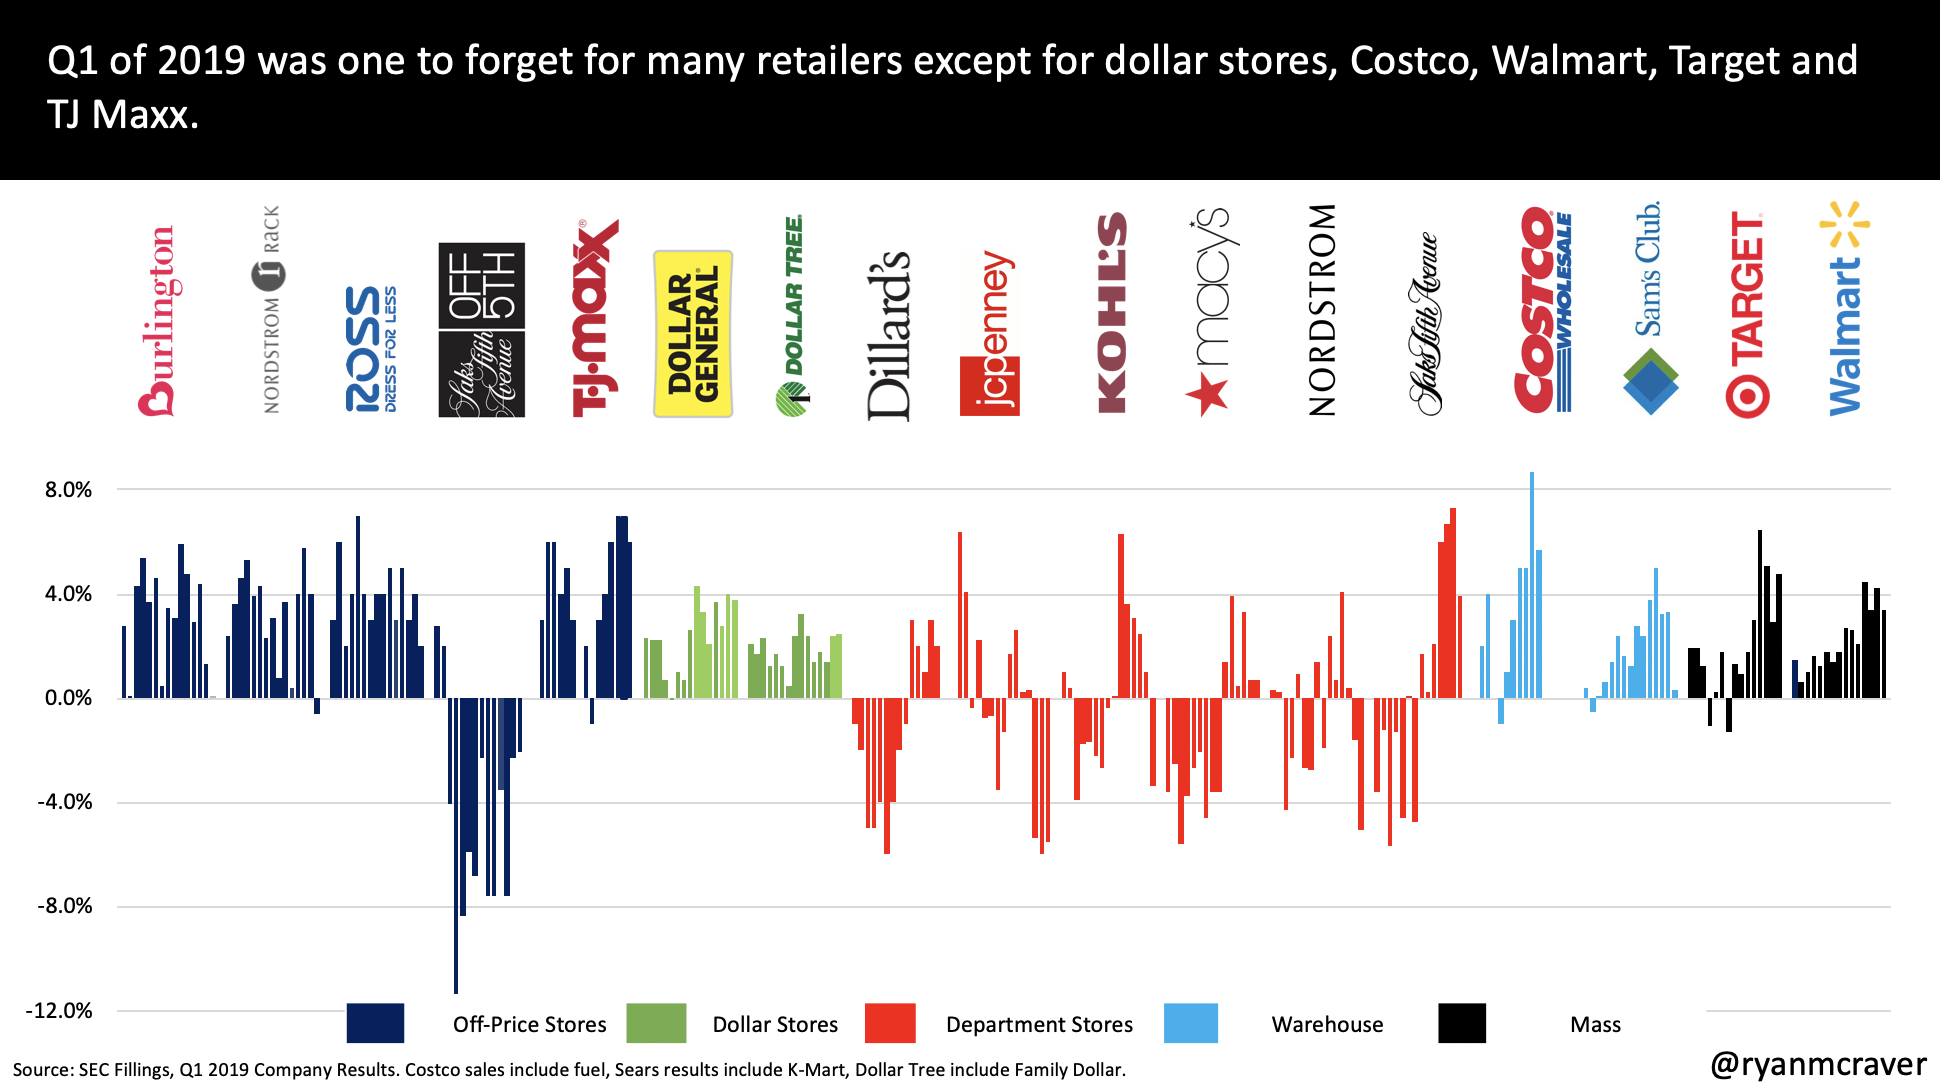
Last night concluded the Q1 earnings season for a majority of the key retailers. For many of those retailers, Q1 was one to forget. Some of the data points I was left with:

  • Nordstrom Full Line and Nordstrom Rack posted the worst negative comps since the depression at -5.1% and -0.6% respectively.

  • Kohls surprised many with a -3.4% comp (first negative since Q2 2017) and now saying there will be negative earnings growth for the full year.

  • Ross and Burlington posted slowing comps versus previous quarters.

With all of that said, there was some positive news:

  • Costco remains on fire posting the 5th consecutive month of >7.0% comp in the US.

  • Walmart and Target both posted respectable increases of 3.4% and 4.8% respectively.

  • TJ Maxx remains hot with 4th consecutive quarter of >6.0% comp.

  • Dollar Stores continue to gain share with 2.5-4.0% comp increases.

The trends continue. Department Stores losing share to the mass, off price and dollar stores continues with the data showing there is no slowing to the shift.

@ryanmcraver Retail Comp Sales

Roku Momentum Continues

Roku recently released their earnings with strong year over year streaming and continued growth of ARPU and users. Most growth rates were slightly higher than Q4. Some of the highlights for Q1:

  • Platform revenue grew 78% year over year (up slightly from 77% last quarter) for the quarter to $134mm.

  • Streaming hours grew close to 74% year over year (up slightly from 70% last quarter) for the quarter to 8.9 billion hours.

  • The average revenue per user is now just under $18 with over 27 million active users (40% growth rate year over year for the quarter).

  • Most impressively, Roku now estimates their software is on 1 in 3 smart TVs sold in the US, this is up from 1 in 4 in previous quarters. Roku is now the #1 smart TV OS.

Other than a slightly slower increase to ARPU, this was a continued vote of confidence for Roku playing a leading role in the switch to on demand streaming.

Amazon = The Service Provider

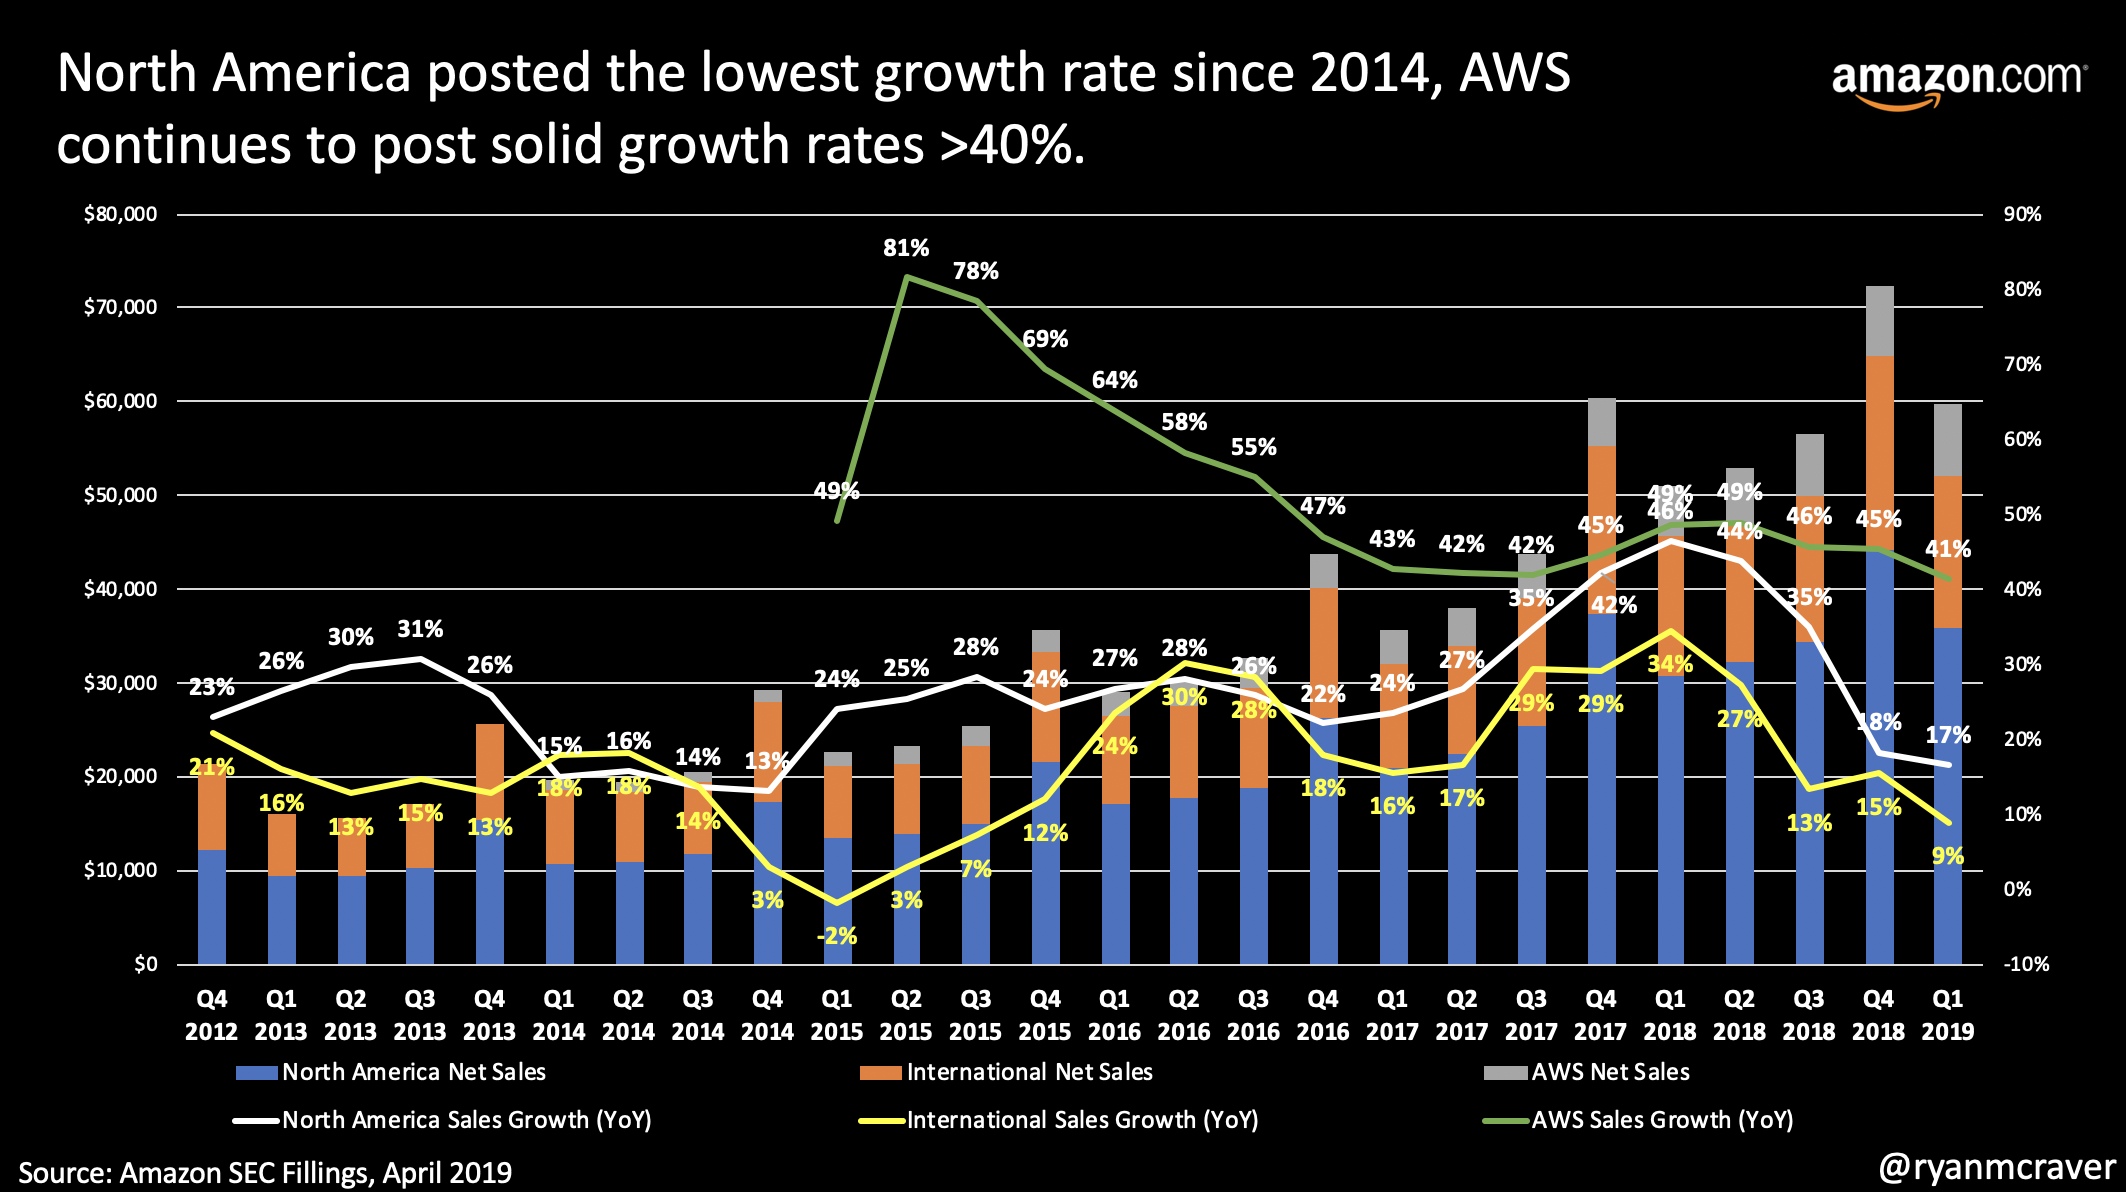
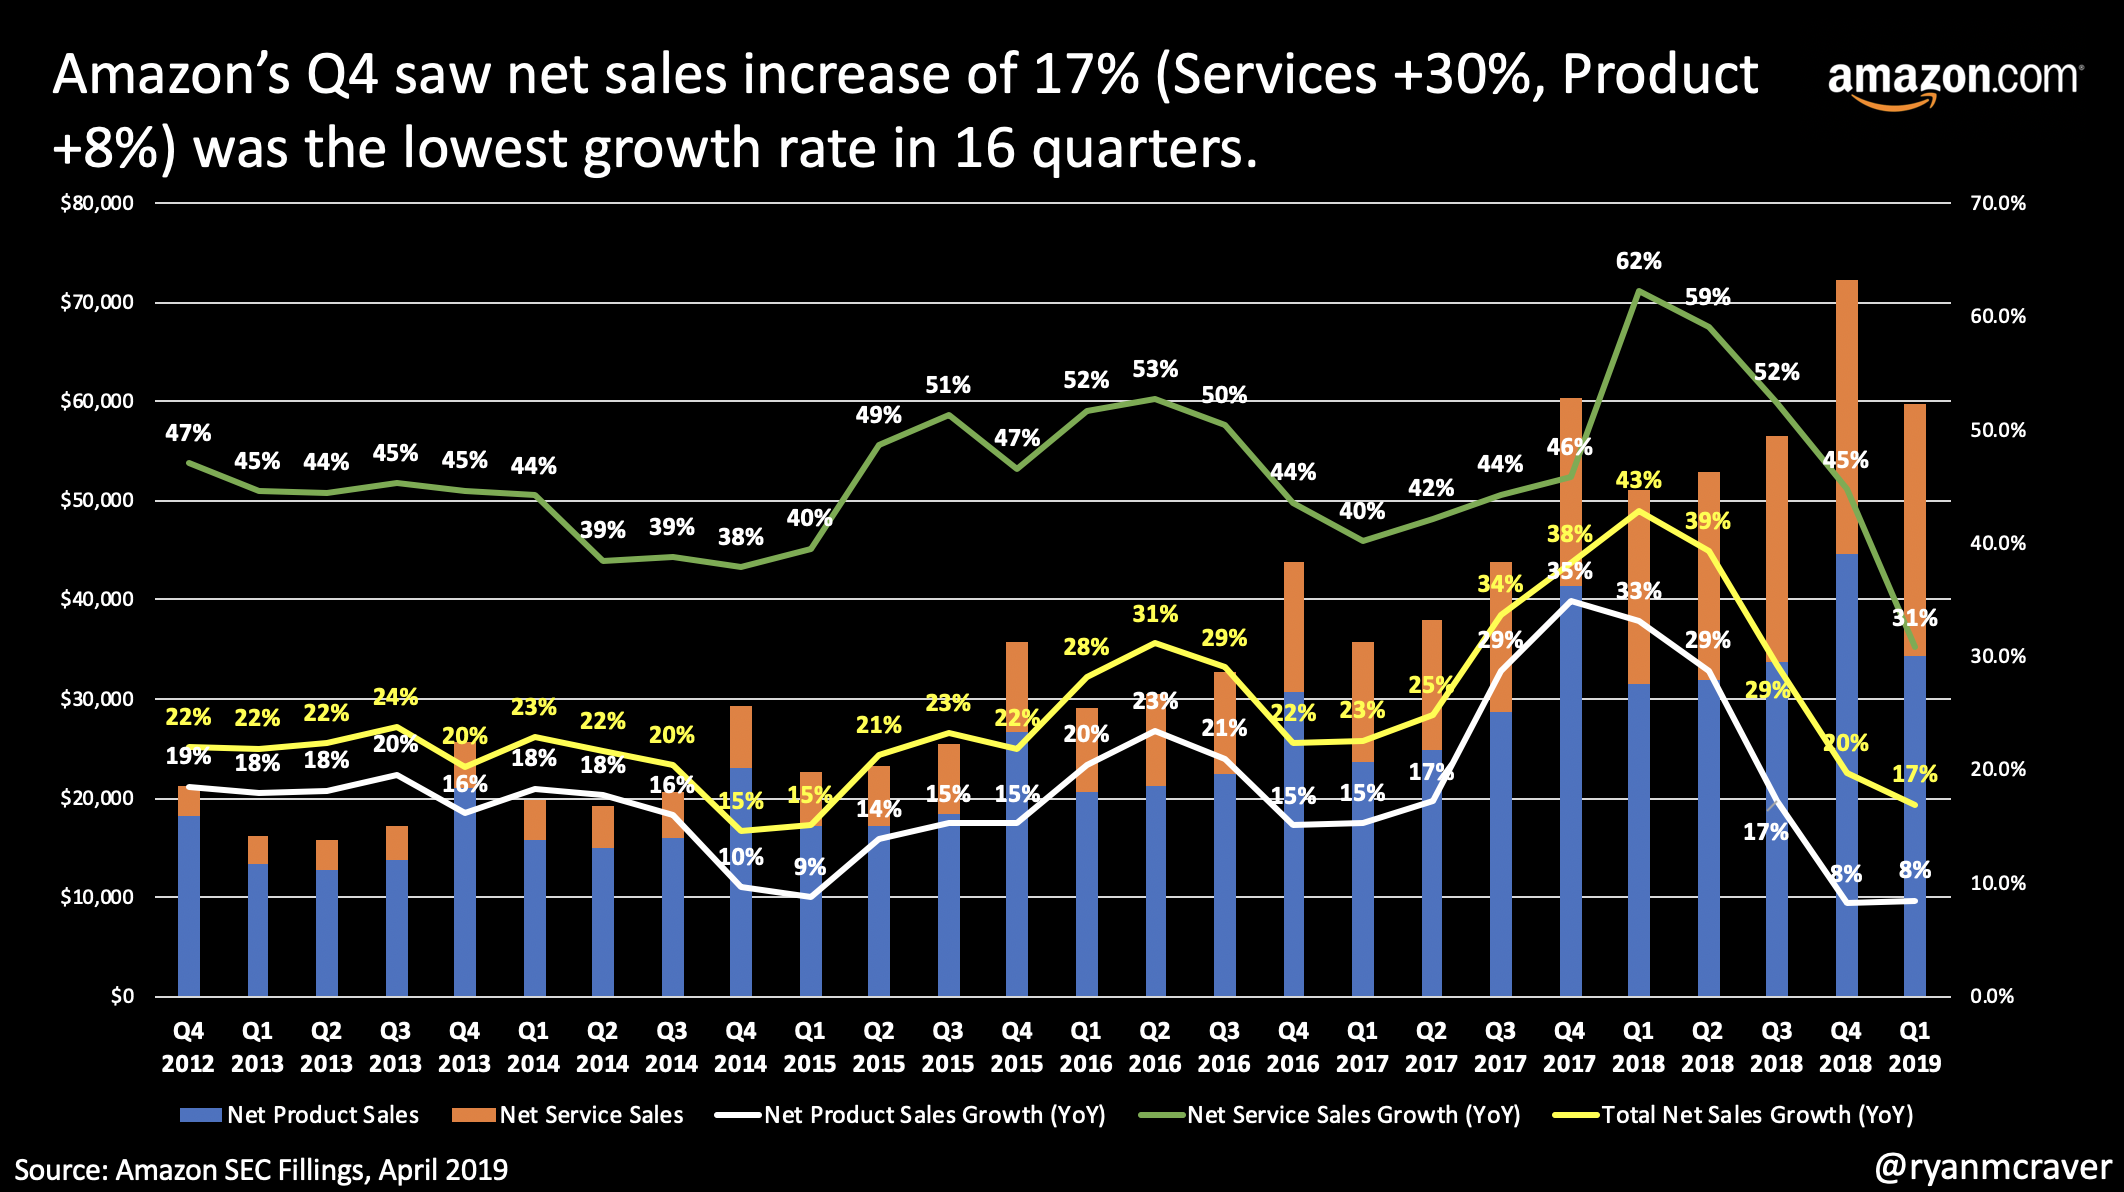
This was a well played and planned earnings release by Amazon. The January earnings release saw the slowest sales growth rate in 16 quarters which continued to slow even further in the recently quarter. The North America business hadn’t posted this small of an increase since 2014 and international since 2015. Whether due to the law of large numbers or the competition stepping up their game, one thing is certain. Amazon is becoming much more profitable as the company becomes less reliant on online owned sales.

So why was Amazon trading up post earnings? In the latest quarter, online accounted for less than 50% of the total revenue in the quarter. Third party revenue (seller services) accounted for 18% with the real growth coming from AWS and subscriptions at 13% (up from 10%) and 7% respectively (up from 5%). Services, services, services = profits, profits, profits. Yes, the p word that no one believes Amazon was capable of just 2 short years ago.

Despite some of the weakest revenue growth figures in years, Wall Street and Main Street still like what they heard and still believe in the Prime, AWS, Services shift.


Amazon's Quest to Become eBay and Alibaba

If anyone had any doubt that Amazon is sick of owning inventory and is more focused on selling services than Apple is, look no further than Jeff Bezos comments in today’s shareholder letter:

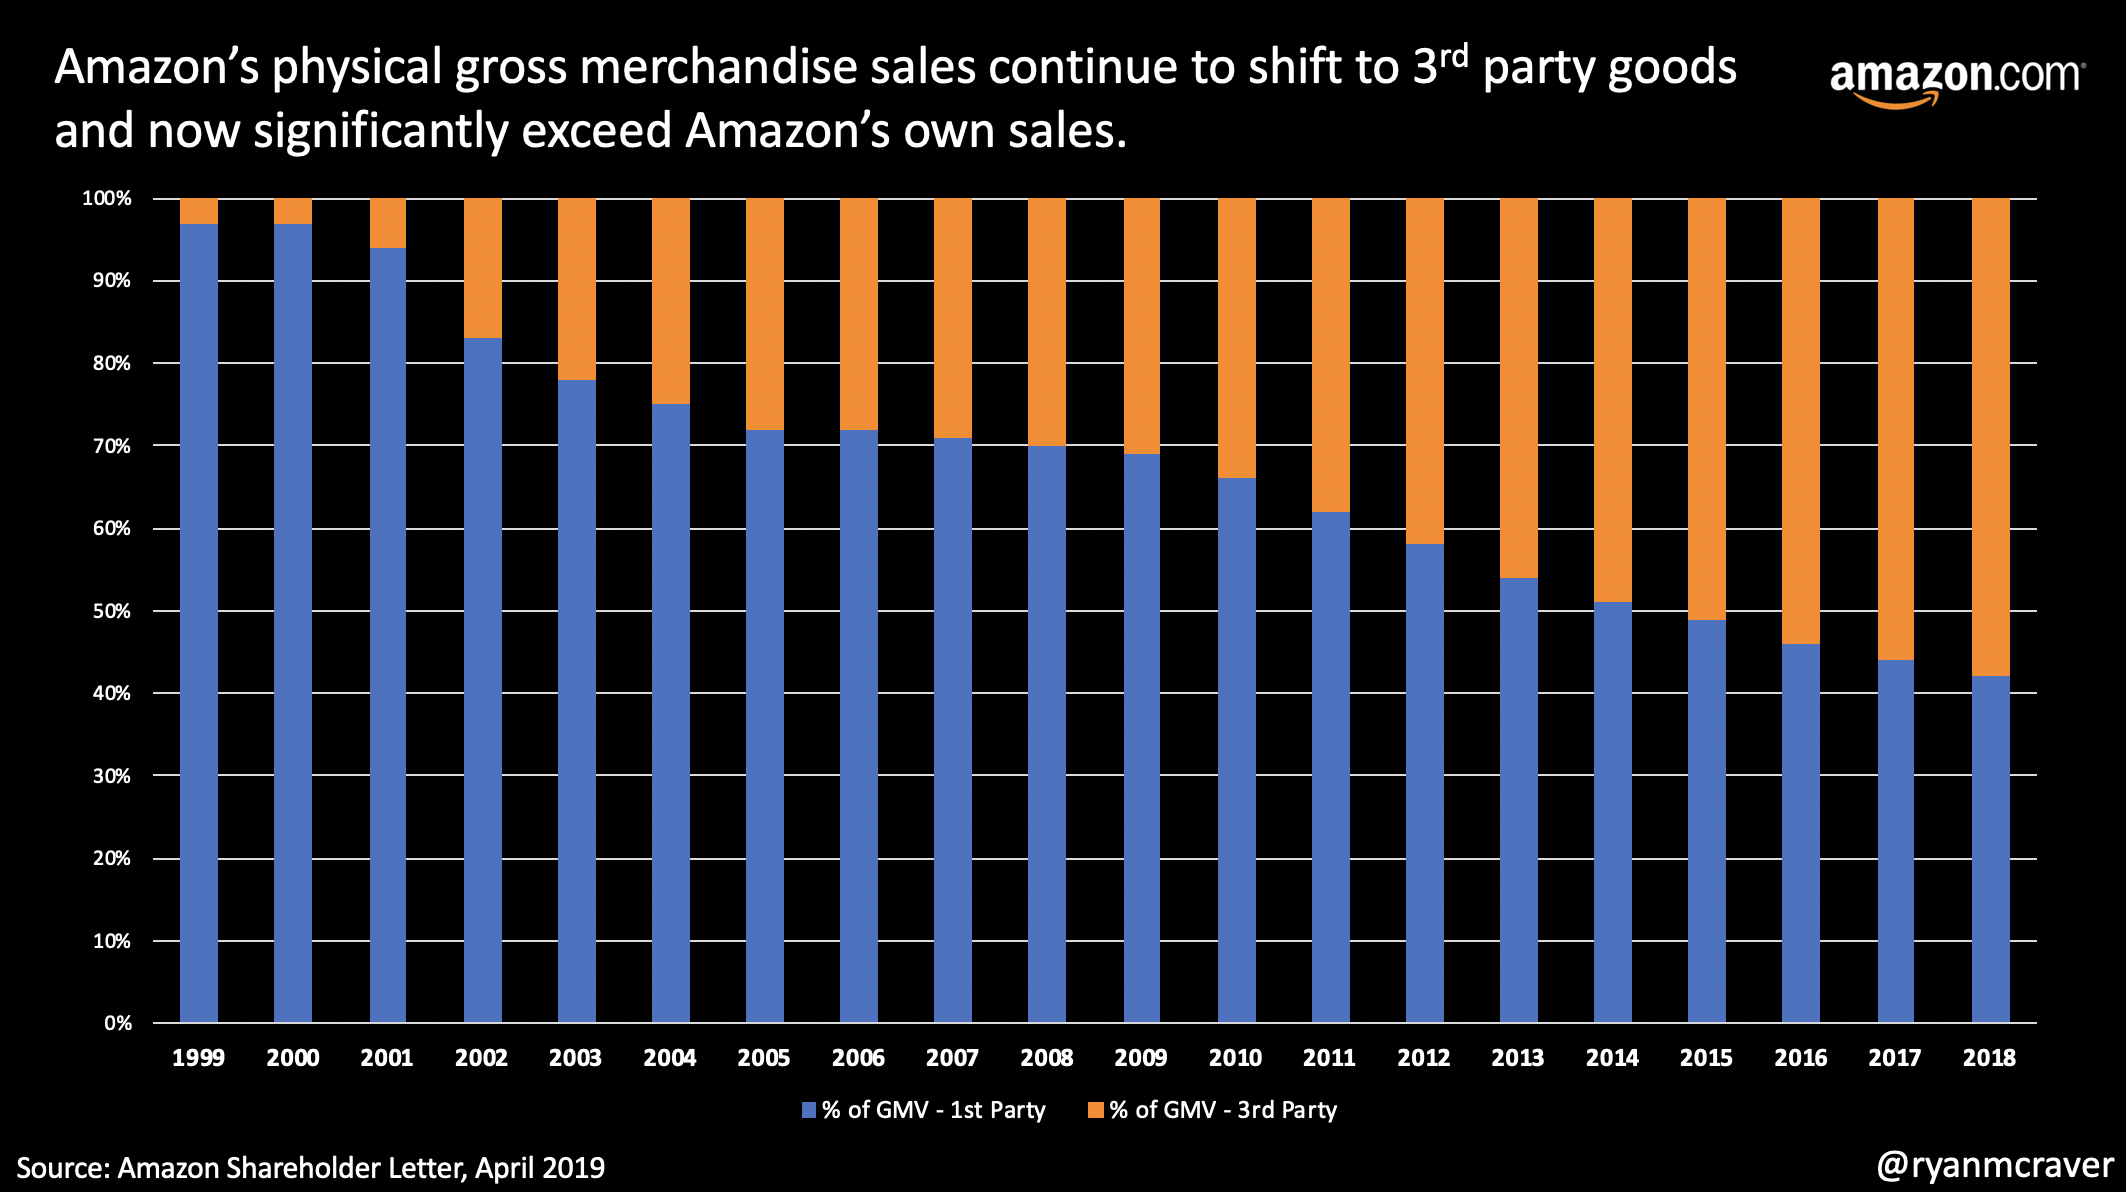
The percentages represent the share of physical gross merchandise sales sold on Amazon by independent third party sellers – mostly small- and medium-sized businesses – as opposed to Amazon retail’s own first party sales. Third-party sales have grown from 3% of the total to 58%. To put it bluntly: Third-party sellers are kicking our first party butt. Badly. And it’s a high bar too because our first-party business has grown dramatically over that period, from $1.6 billion in 1999 to $117 billion this past year. The compound annual growth rate for our first-party business in that time period is 25%. But in that same time, third-party sales have grown from $0.1 billion to $160 billion – a compound annual growth rate of 52%. To provide an external benchmark, eBay’s gross merchandise sales in that period have grown at a compound rate of 20%, from $2.8 billion to $95 billion. Why did independent sellers do so much better selling on Amazon than they did on eBay?

Although Jeff takes a swing at eBay, Amazon truly realizes the beauty of the inventory-less business models used by eBay and Alibaba. Lower cash requirements and better margins. When you chart out the growth, the growth is truly staggering:

Scooter Stats

Fascinating statistics and reporting on the economics of scooters from players like Lime and Bird. Not looking like the best of business models.

  • The average lifespan of a scooter was 28.8 days

  • The median lifespan was 26 days

  • The average vehicle went 163.2 miles over 92 trips during its lifetime

  • Five of the 129 initial-cohort scooters disappeared the same day they went into service (a lifespan of “0” days)

  • The scooter with the longest lifespan made it 112 days, last appearing in the data on Nov. 29

  • Only seven of 129 scooters lasted more than 60 days

Utilization

  • The average trip lasted 18 minutes

  • The average scooter did 3.49 rides per day

Revenue

  • Bird charges $1 to unlock a scooter and $0.15 per minute

  • At 18 minutes, the average trip generated $3.70 in revenue (note that this, based on three months of data in Louisville, is nearly identical to the $3.65 in revenue per ride Bird reportedly told investors it was averaging as of June)

  • At 3.49 rides per day, the average scooter generated $12.91 in revenue per day

General costs, based on reporting by The Information

  • Bird spent $1.72 per ride on charging costs

  • It spent another $0.51 per ride, on average, on repairs

  • Credit-card fees cost $0.41 per ride

  • Customer support adds $0.06 per ride

  • Insurance is $0.05 per ride

  • This adds up to $2.75 in what you could consider operating costs per ride

Louisville-specific costs, from the city’s dockless vehicle policy

  • A company pays $2,000 for a probationary license (required for the first six months of operation)

  • It pays an additional $1,000 to receive a full operating license

  • The city charges an annual $50 fee per allotted dockless vehicle

  • Plus a daily $1 fee per dockless vehicle

  • And $100 per designated group parking area

Louisville scooternomics, in sum:

  • A scooter generates $3.70 in revenue per ride

  • Deducting per-ride costs of charging, repairs, credit-card fees, customer support, and insurance, leaves $0.95 per ride

  • Multiplied by 3.49 rides per day is $3.32 in net revenue per scooter per day

  • Minus the city’s $1 daily fee leaves $2.32

Source: https://qz.com/1561654/how-long-does-a-sco...

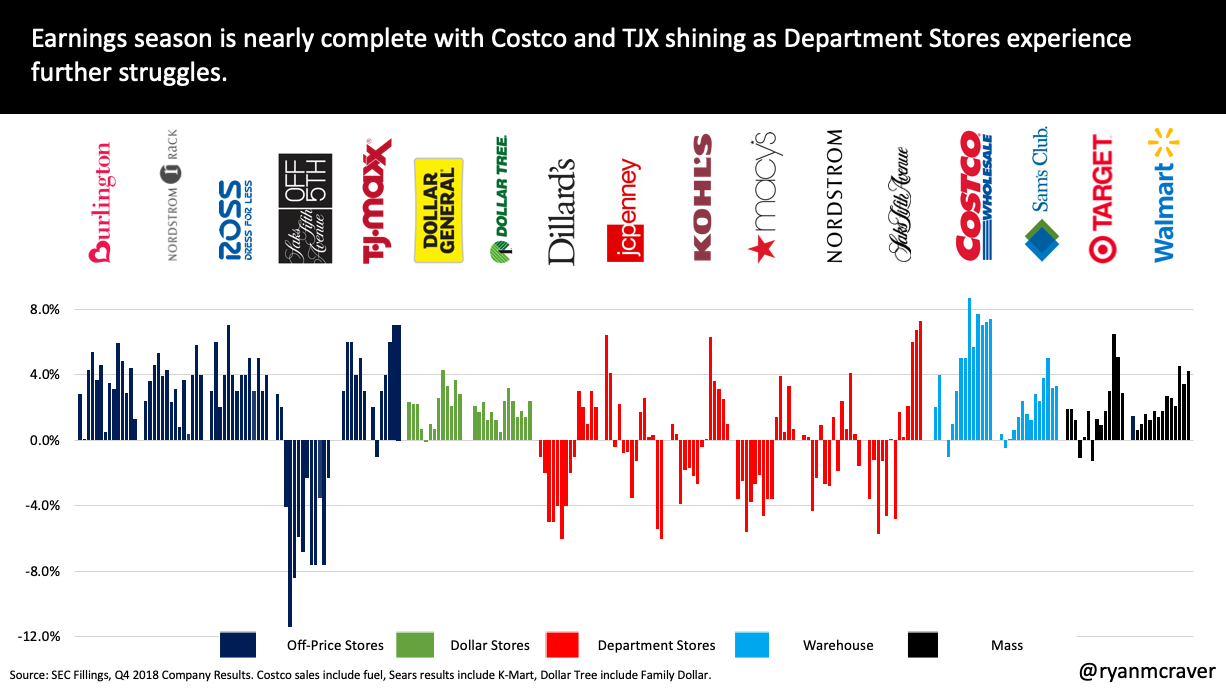
Retail Share Shifts Starting 2019: Costco & TJX

Comp sales released during earnings are a backward indicator of success in the preceding quarter but generally provide a view of how market share is shifting amongst like for like retailers as well as share leaving one sector to another. A couple of takeaways from this past quarter:

  • Costco is on fire. The warehouse club has posted 4 consecutive quarters of >7.0%. Phenomenal.

  • Off-price remains positive. All majors such as Burlington, Nordstrom Rack, Ross and TJX posted increases. Burlington was weakest amongst the majors and TJX posted a 3rd straight result >6.0%.

  • Big box mass sees above average results with Walmart posting an impressive 4.2% and Target just under 3.0%.

  • Department Stores remain difficult. From the abysmal results of JC Penney to the tepid results of Macy’s and Kohls.

I remain convinced that Costco still remains the best play in retail with their strong membership base moat and industry leading comp results. Second to Costco is TJX as they gain share from Department Stores and other retail bankruptcies.

ryanmcraver Retail Comps